Screenshots of the images are attached in the GitHub

Code to produce graphs:
  ```{r}
  # Installing packages
  library(dplyr)
  library(ggplot2)
  library(leaflet)
  ```

  ```{r}
  # Setting and reading csv
  file_path <- "C:/Users/Makayla Slick/Downloads/ODF_Fire_Occurrence_Data_2000-2022.csv"
  ODF_fire_data <- read.csv(file_path)

  # attaching and reading Data
  attach(ODF_fire_data)
  ```
  ```{r}
  fire_map <- leaflet(fire_data) %>%
    addTiles() %>%  # Use the default OpenStreetMap tiles
    addCircleMarkers(
      lng = ~Long_DD,
      lat = ~Lat_DD,
      popup = ~paste("FireName: ", FireName, "
 EstTotalAcres: ", EstTotalAcres),
      label = ~FireName,
      color = "red",
      fillOpacity = 0.05,
      radius = .15
    ) %>%
    addLegend("bottomright", colors = "red", labels = "Fire Incidents")

  # Display the map
  fire_map
  ```
  ```{r}
  # Create a bar chart for the count of fires by CauseBy
  fires_count_chart <- ggplot(ODF_fire_data, aes(x = CauseBy)) +
    geom_bar(fill = "green", alpha = 0.7) +
    labs(title = "Number of Fires by CauseBy",
         x = "CauseBy",
         y = "Number of Fires") +
    geom_text(stat = "count", aes(label = ..count..), vjust = -0.5, size = 3) +
    theme(axis.text.x = element_text(angle = 45, hjust = 1))

  fires_count_chart
  ```
  ```{r}
  # Create a bar chart for the count of fires by CauseBy
  fires_count_chart <- ggplot(ODF_fire_data, aes(x = FO_LandOwnType)) +
    geom_bar(fill = "pink", alpha = 0.7) +
    labs(title = "Number of Fires From Each Type of Source",
         x = "Type of Land Ownership",
         y = "Number of Fires") +
    geom_text(stat = "count", aes(label = ..count..), vjust = -0.5, size = 3) +
    theme(axis.text.x = element_text(angle = 45, hjust = 1))

  fires_count_chart
  ```

  ```{r}
  ruralres_df <- ODF_fire_data %>%
    filter(FO_LandOwnType == "Rural Residential")
  ```

  ```{r}
  industrial_df <- ODF_fire_data %>%
  filter(FO_LandOwnType == "Industrial")
  ```

  ```{r}
  # Create a bar chart
  industrial_cb_barchart <- ggplot(ODF_fire_data, aes(x = CauseBy)) +
    geom_bar(fill = "lightblue", alpha = 0.7) +
    labs(title = "Number of Fires From Each Type of Source in Rural Residential Areas",
         x = "Caused By",
         y = "Number of Fires") +
    geom_text(stat = "count", aes(label = ..count..), vjust = -0.5, size = 3) +
    theme(axis.text.x = element_text(angle = 45, hjust = 1))
  industrial_cb_barchart
  ```
  ```{r}
  rr_cb_bb <- ggplot(ruralres_df, aes(x = CauseBy)) +
    geom_bar(fill = "violet", alpha = 0.7) +
    labs(title = "Number of Fires by CauseBy in Rural Residential Areas",
         x = "Caused By",
         y = "Number of Fires") +
    geom_text(stat = "count", aes(label = ..count..), vjust = -0.5, size = 3) +
    theme(axis.text.x = element_text(angle = 45, hjust = 1))
  rr_cb_bb
  ```
Graphs and Maps of Data
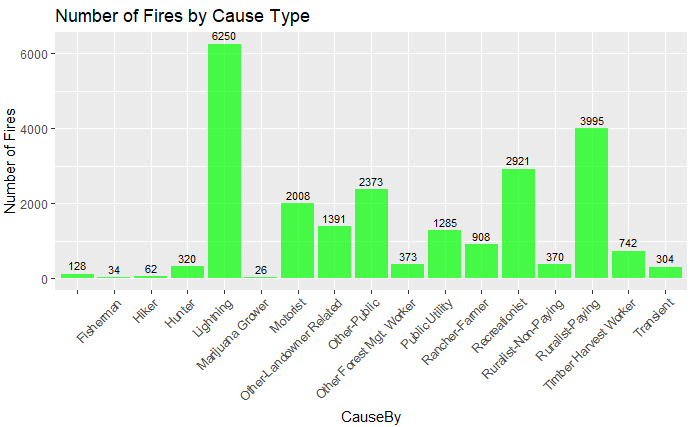
The graph above shows the number of fires for each type of fire cause.
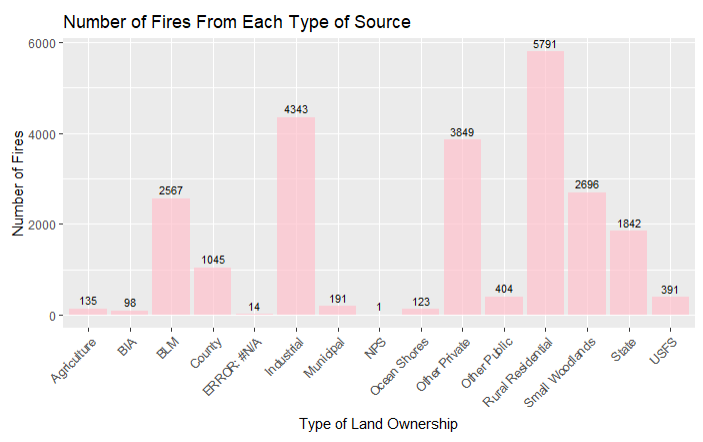
The graph above shows the number of fires across the whole dataset that occured on different land types.
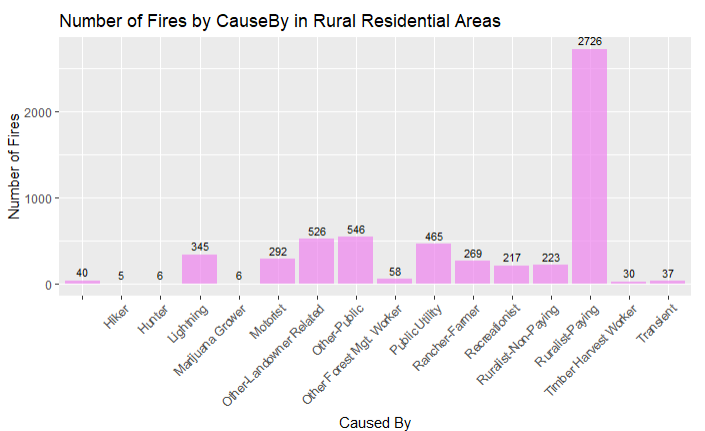
The graph above shows the number of fires for different types of fire causes in rural residential areas.
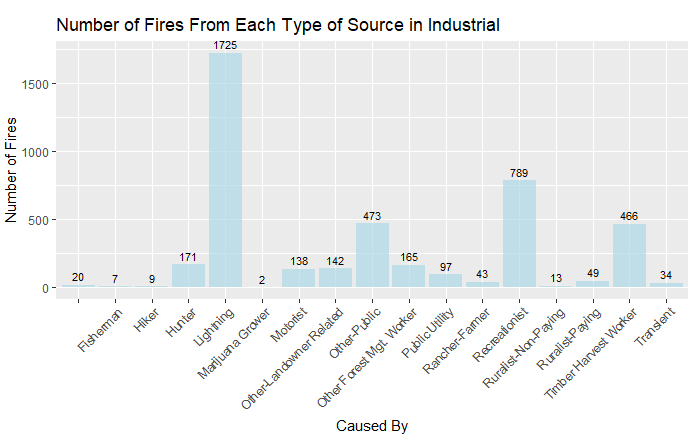
The graph above displays the number of fires for different types of fire causes in industrial areas.
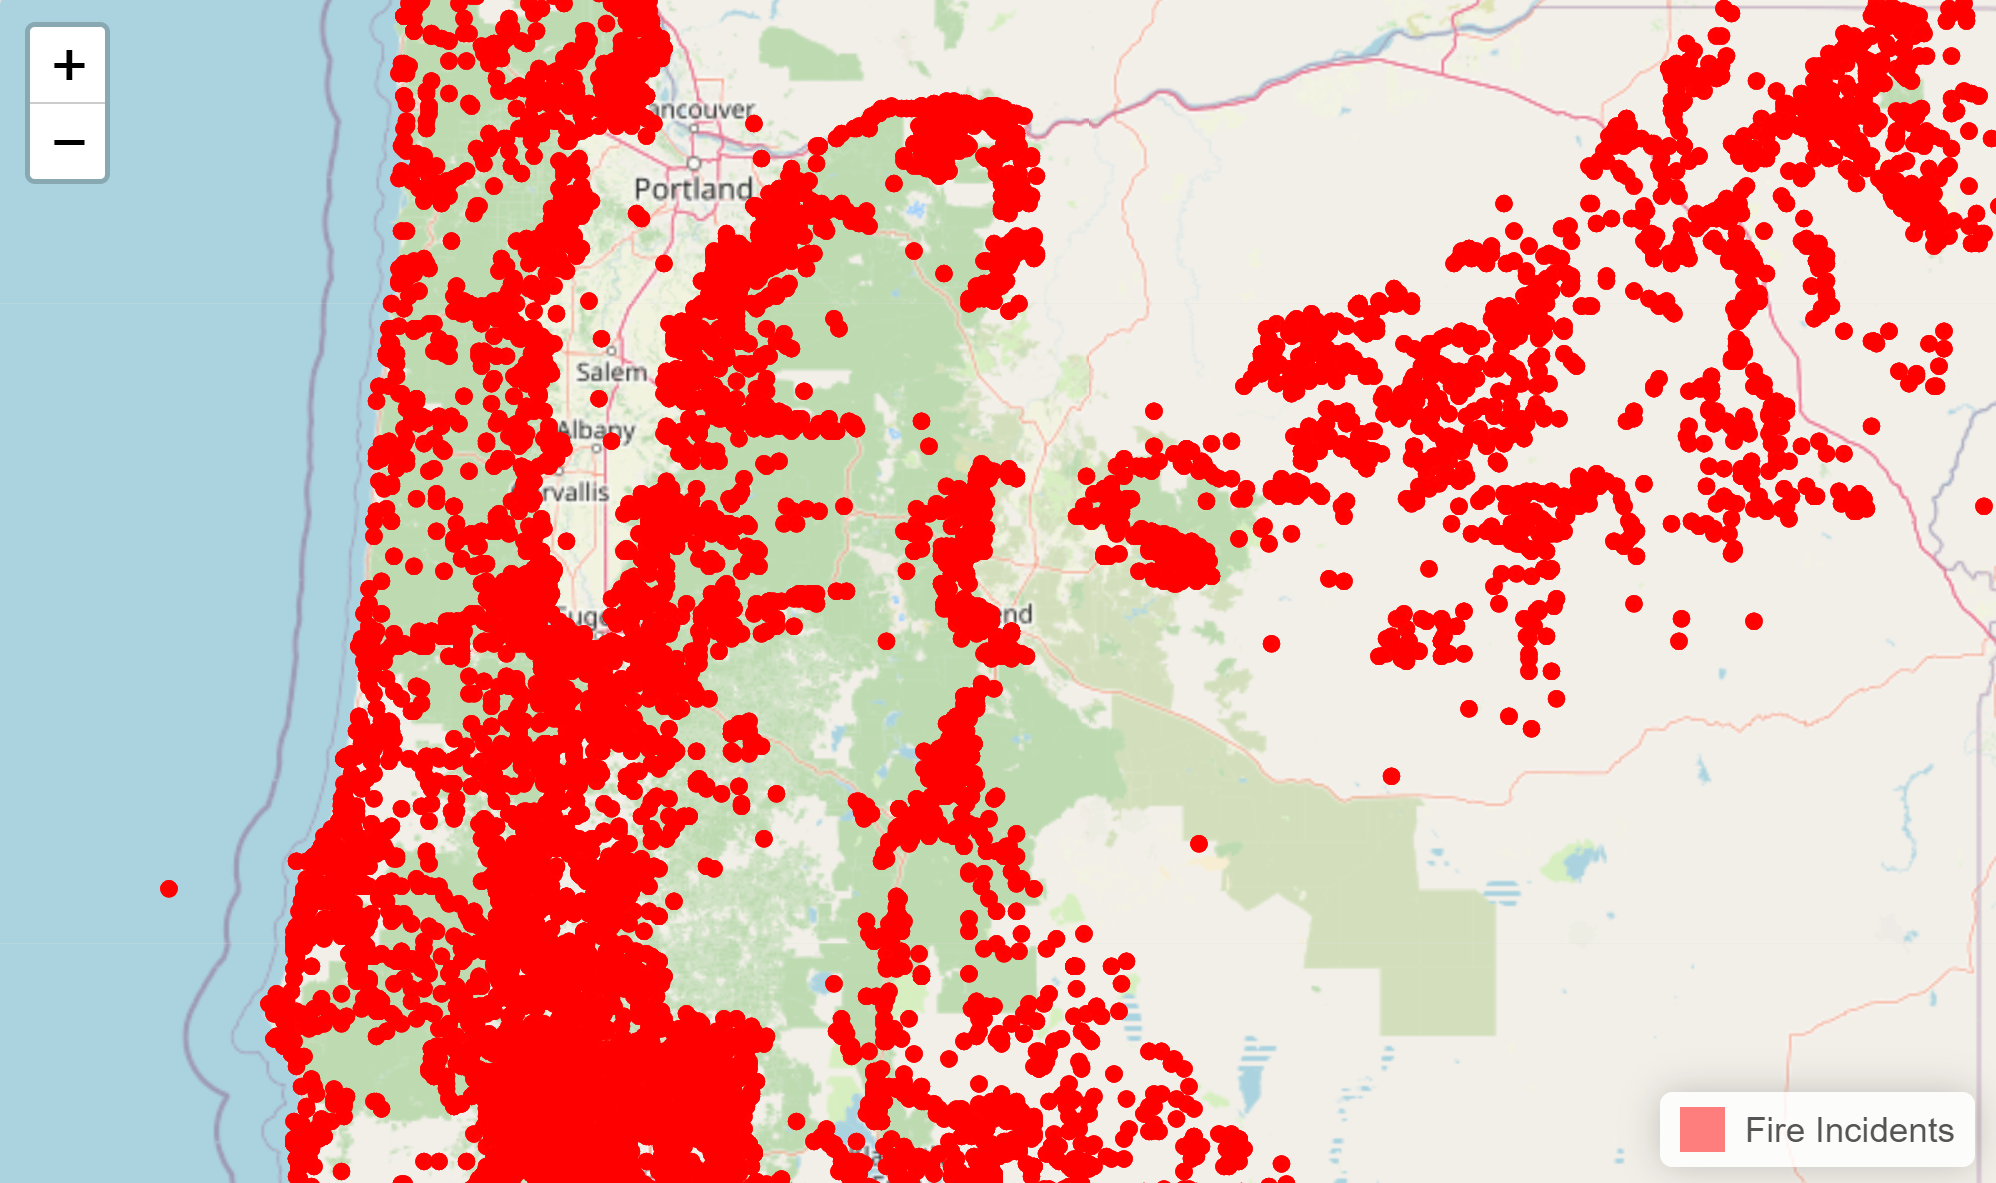
The map above shows the distribution of fires across Oregon.
Analysis
      The chart of the number of fires by each cause of fire shows that lightning is the highest risk for wildfires,
      followed by ruralist playing and recreationist causes. This analysis, coupled with the following graph showing the highest
      number of fires occur in rural residential and industrial areas allows for an understanding of what are the
      most common causes of fires within these two areas and how it compares to fires in general. In rural residential areas,
      the largest cause for fire is ruralist paying. This also give more insights to lower priorities for wildfire mitigation, whereas in
      the first graph at first glance lightning appears to be the highest concern, which is not true in all areas. Though there is a
      higher rate of fires caused by ruralists paying. This information allows for further research into the preventative measures
      in this scope. In the industrial areas, the highest cause for wildfires includes both lightning as well as recreationist. Therefore,
      fire mitigation tasks and projections can be made for these two sectors when understanding how to prevent the most common fire causes.
      For example, research into vegetation encroachment risks surrounding power lines may be necessary in order to prevent ignitions from power
      lines, or bush and tree fires affecting power lines.
      In comparison to the map showing the distribution of fires across Oregon, it can be seen there is a higher ratio of the fires on the west
      coast of Oregon, through central Oregon, and a slightly higher ratio of fires in northeastern Oregon, compared to southeastern Oregon. This
      information can provide specific hotspots for wildfires, and priority regions for wildfire mitigation.